2015 Financial Report
Happy new year, everyone!
It’s been 12 months since we reported that 2014 was Microcosm’s best year ever (and not just financially). Well, we are stoked (and relieved) to report that 2015 was even better than that.
Since last January 1, we’ve published 14 books, a box set, and a documentary DVD. We have even more than that lined up for 2016, and our production schedule is full through 2018! This year is a big deal for us in part because it’s the year we got *ahead*—that means that most of the next two years’ books are at a stage where almost nothing will ever have to happen again in a frenzied, typo-laden, overwhelmed rush. We can’t wait to show you what’s coming out next.
We had some big staff changes this year. Tim moved back to sunny LA, and our editor Taylor stepped up to fill his shoes as publicity manager. Erik sallied forth to open a bar/coffeeshop and Thea joined us to direct our sales efforts, and we also hired Cyn (interview coming soon!) to help get our books in more stores.
In addition, we participated in 20 events and 3 author tours (our annual Dinner and Bikes tour, Bob Suren’s Crate Digger tour (actually 2 tours) and Dawson Barrett’s two-part Teenage Rebels tour).
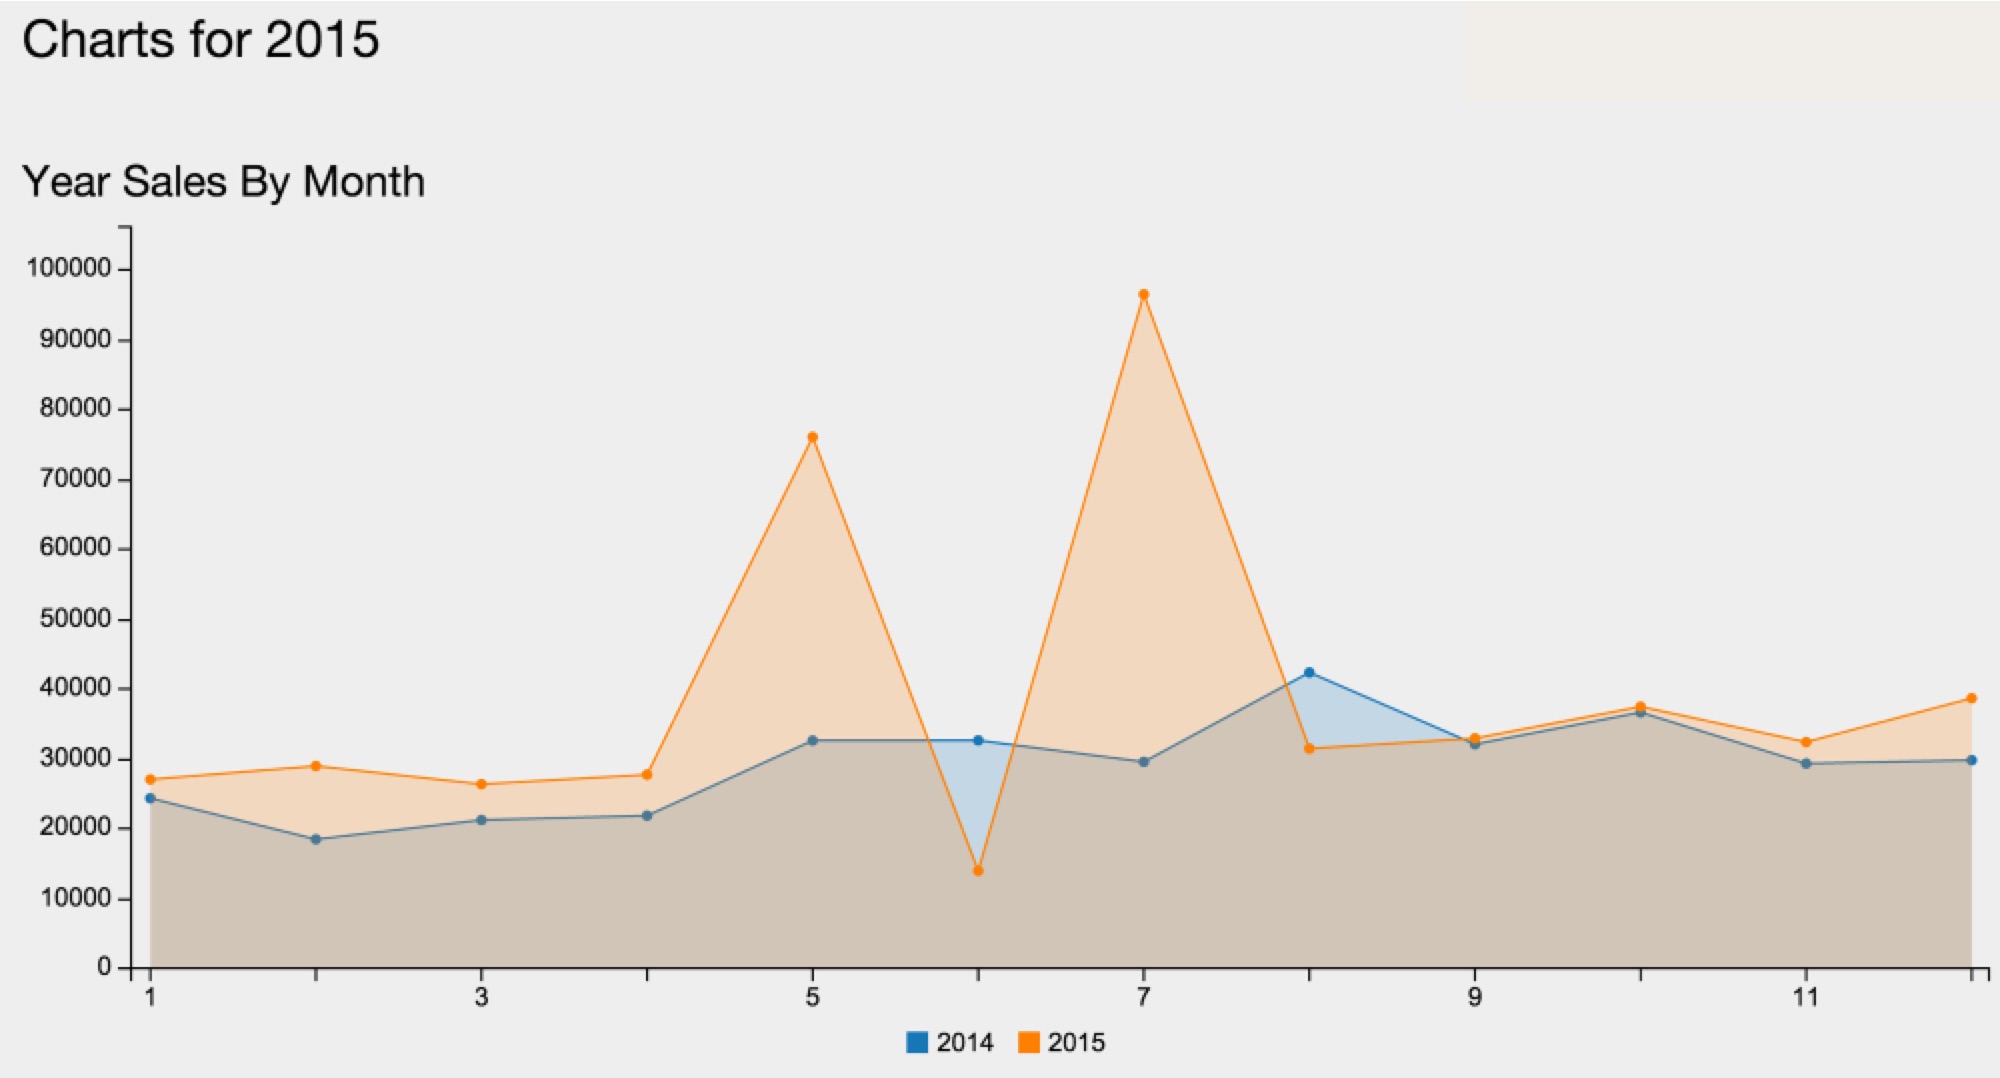
It’s more complicated than it seems like it ought to be to calculate how many books we sold, but our best estimate is that we sold about 120,000 books last year; that’s 328 books a day! No wonder we’re all a little tired.
Here’s a breakdown of our income and expenses for all of 2015, powered by charts:
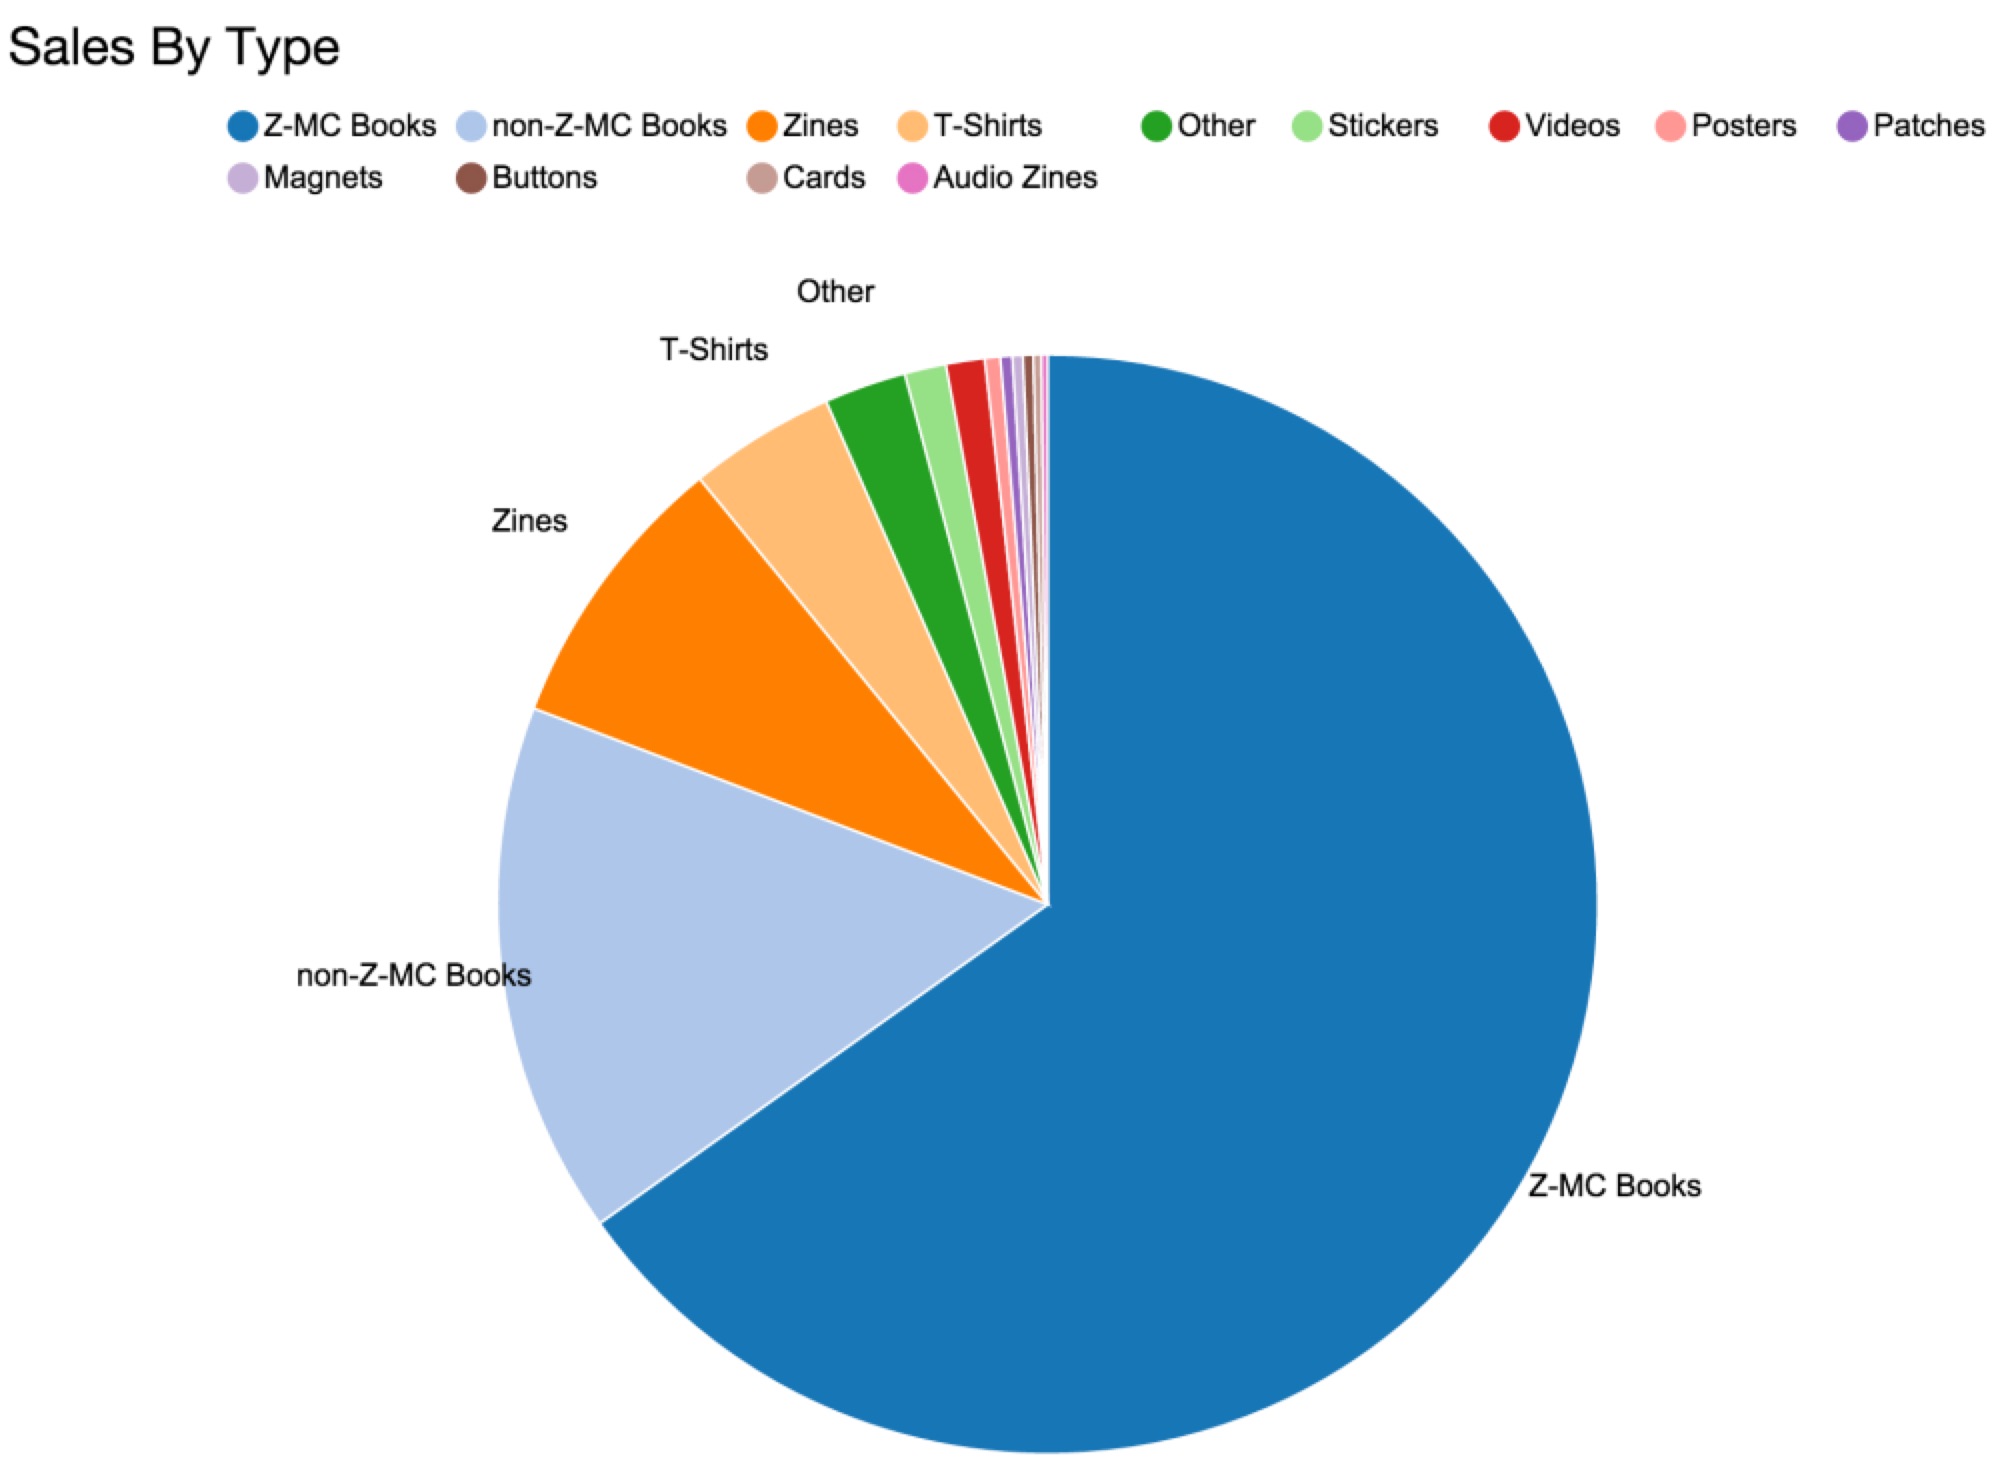
Our total income for the year was $468,733.33 (a 21% increase from 2014). Here’s a pie chart that shows where that came from. “Z-MC books” means books that we published, whereas “non-Z-MC books” means books we distribute from other publishers. “Other” is mostly the ever-popular Slingshot planners.
And here are our expenses. “Z-MC Products” are printing costs for our published books; just plain “Products” includes other publishers’ books that we distribute, blank t-shirts and t-shirt printing, patches, stickers—the cost of any goods we sell.
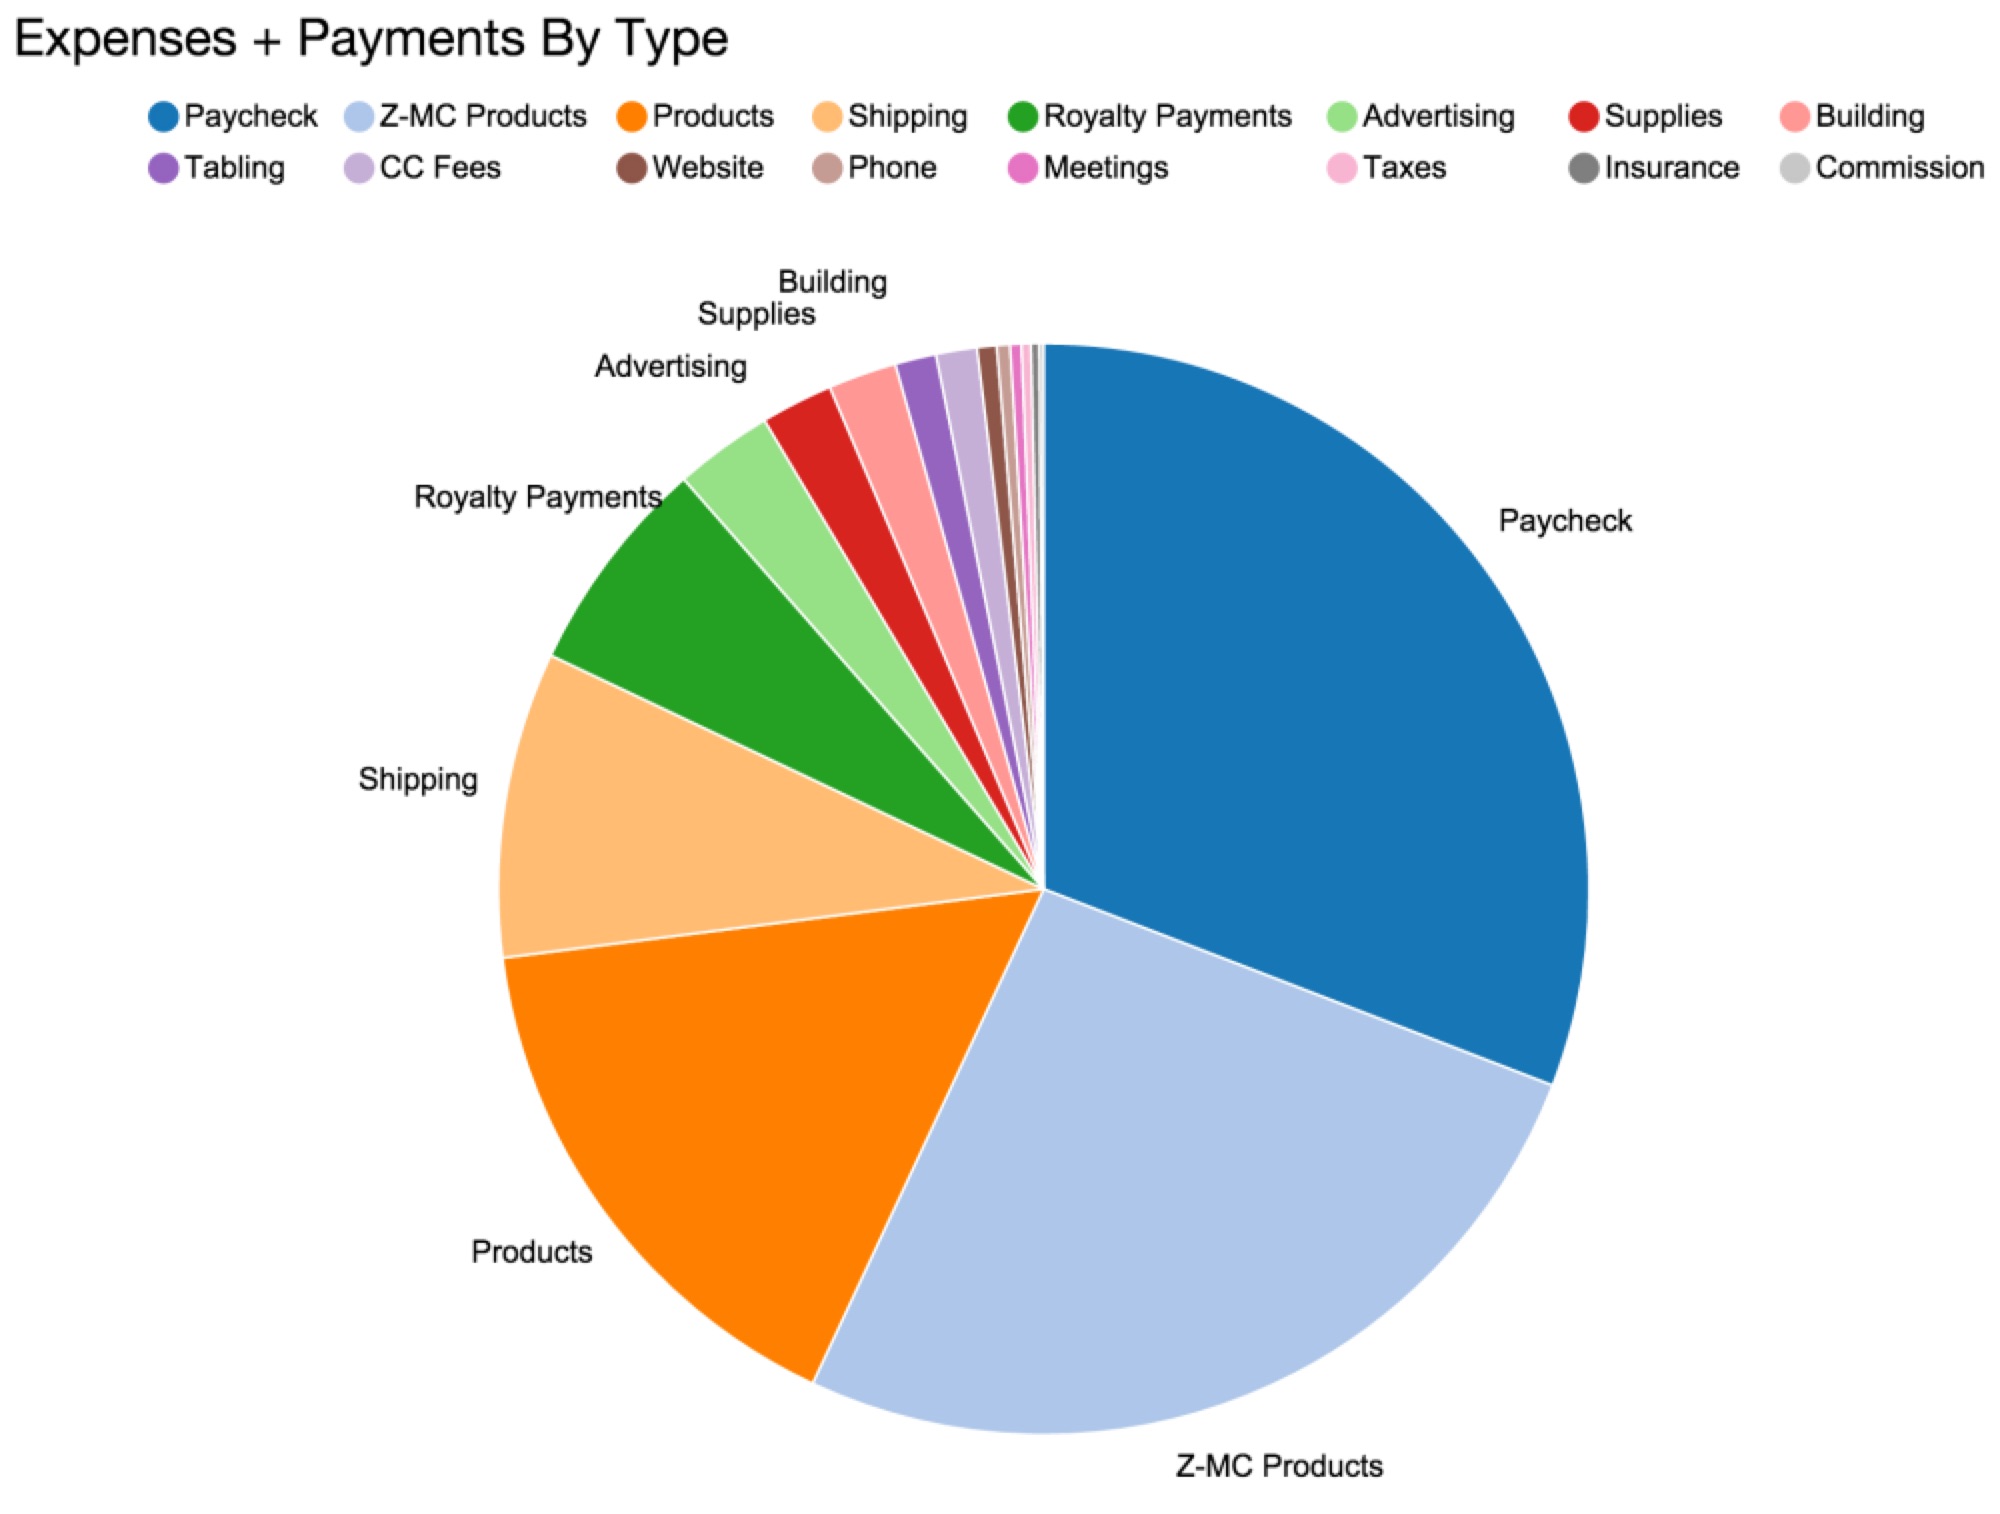
- Wages: -153,083.01 (49% increase)
- Publishing: -127,104.69 (44% increase)
- Distribution: -78,037.61 (32% increase)
- Shipping: -44,092.71 (24% increase)
- Royalties: -31,583.19 (17% increase)
- Advertising: -14,203.36 (229% increase)
- Supplies & Phone: -12,311.75 (19% decrease)
- Building: -9,867.90 (53% decrease)
- Commission: -6,073.06 (100% increase)
- Events: -5,938.56 (64% increase)
- Meetings: -1,625.70 (100% increase)
- Taxes: -1,364.00
- Insurance: -1,183.00
- Donations $29,520
- Total: $-11,662.14 (yikes, but we’re already making it up)
Among other revelations amongst these numbers, we paid more in wages this year than we did to our printer. That’s a first!